
For any chromatographer, whether seasoned or just starting, the ultimate goal is to achieve good separation between analytes.
This separation, known as resolution (Rs), is not a matter of chance but can be understood and manipulated through a fundamental relationship called the master resolution equation.
While diving deep into theoretical equations might not be every practical chromatographer’s favorite pastime, grasping this particular one can significantly simplify your method development and troubleshooting efforts.
This article provides a breakdown of the concepts discussed by Dr. Lee Polite in a recent video. We highly encourage you to watch the full video for a more visual and in-depth explanation, complete with whiteboard illustrations that bring these ideas to life.
Master The 4 Essentials
Master the 4 essentials chromatography skills, troubleshooting, maintenance, method development and optimization, by taking the 5-day hands-on LC/GC Bootcamp at Axion Labs.
The Three Pillars of Resolution
The master resolution equation elegantly demonstrates that to achieve good chromatographic resolution, three key factors come into play: efficiency (N), selectivity (α), and capacity factor (k). Mathematically, it’s often expressed as:
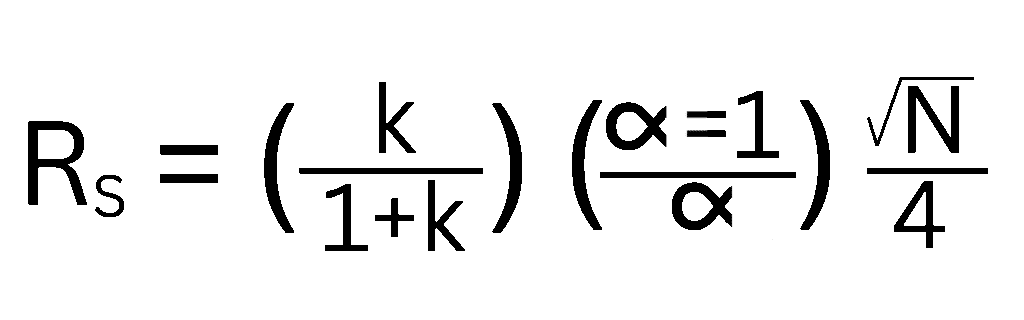
Let’s break down what each of these terms means for your separations:
- Efficiency (N): Often referred to as plate number, efficiency describes the narrowness of the chromatographic peaks. Higher efficiency leads to sharper peaks, which are easier to resolve.
- Selectivity (α): This factor represents the difference in retention between two adjacent peaks. It’s a measure of how well the chromatographic system (your column chemistry and mobile phase) can chemically distinguish between analytes.
- Capacity Factor (k): Also known as the retention factor, k describes how long an analyte is retained on the column relative to an unretained compound.
The equation clearly shows that the larger these individual factors are, the better your resolution will be.
A Closer Look at the Factors
1. Capacity Factor (k)
The contribution of the capacity factor to resolution is expressed by the term k/(1+k). If you were to plot resolution against the capacity factor, you’d see a steep initial increase in resolution as k increases from zero, which then begins to plateau.
This means that while an infinitely large k would theoretically give the highest resolution, it would also lead to impractically long run times. The practical advice is to aim for a k value between 1 and 5.
- If your k is very low (e.g., less than 1), you’re sacrificing a significant amount of potential resolution. For instance, a k of 1 means the k/(1+k) term is 1/(1+1)=0.5, indicating you’re halfway to the maximum contribution from this term.
- Increasing k from 0.5 to 1, or 1 to 2, yields substantial gains. However, the improvement diminishes as k gets larger (e.g., increasing k from 4 to 5 offers less marginal benefit than from 1 to 2).
- The takeaway? If your k values are low, focus your efforts here first. Small adjustments can lead to big improvements in resolution without drastically increasing analysis time.
2. Selectivity (α)
Selectivity is where the “chemistry” of your separation truly shines. It’s influenced by your choice of stationary phase (e.g., C8, C18, cyano, phenyl) and mobile phase composition. The selectivity term in the equation is (α−1)/α.
- For Liquid Chromatography (LC), a general guideline is to aim for an α>1.2. This implies that you need sufficient chemical differentiation between your analytes for good separation.
- For Gas Chromatography (GC), where columns can have vastly higher efficiencies, a lower selectivity of α>1.05 is often acceptable. GC can compensate for lower chemical differentiation with much sharper peaks.
Think of it this way: in LC, if your efficiency (N) and capacity factor (k) are reasonably optimized, selectivity becomes the primary driver for achieving the target resolution (typically Rs>1.5). If you don’t have enough “chemistry” to provide an α of at least 1.2 in LC, you’ll struggle to get good separation. In GC, the “sledgehammer” of high efficiency means you don’t need as much chemical difference to pull peaks apart.
3. Efficiency (N)
Efficiency, represented by the N/4 term, relates to the physical characteristics of your column and system, leading to narrower peaks.
- In LC, typical high-performance systems might yield 10,000, 20,000, or perhaps up to 35,000 theoretical plates if you’re very fortunate. Getting 300,000 plates in conventional LC isn’t realistic.
- In GC, it’s possible to purchase columns off the shelf that offer 400,000 plates or even more.
This vast difference in achievable efficiency is why GC can often operate with lower selectivity values than LC. The sheer peak-narrowing power of high-efficiency GC columns helps to resolve closely eluting compounds.
The Empirical Nature and Practical Goal
The resolution equation is wonderfully empirical, meaning it aligns well with real-world experimental data. This allows chromatographers to predict how changes in k, α, or N will impact their separation. The common goal in method development is to achieve a resolution (Rs) greater than 1.5. This value generally signifies “baseline resolution,” where there’s a clear space between the two peaks down to the baseline.
Measuring Resolution: The Graphical Equation
While the master resolution equation tells us how to influence resolution, we also need a way to measure it from our chromatograms. This is where the graphical resolution equation comes in. It considers how far apart the peak apexes are (ΔtR, the difference in retention times) relative to their widths at the base (wb).
A common way to express this is:
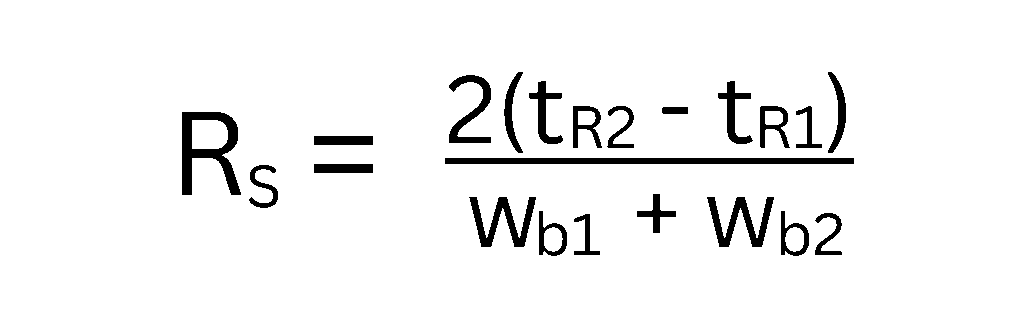
Where:
- tR1 and tR2 are the retention times of the two peaks.
- wb1 and wb2 are the widths of the peaks at their base.
Essentially, if you have two peaks that are one minute apart, is that good or bad separation? It depends on their widths. If the peaks are five minutes wide, a one-minute separation is poor. If they are only 10 seconds wide, a one-minute separation is excellent. This graphical measurement is what chromatography data systems use to calculate the resolution values you see in your reports.
Tying It All Together
The beauty of these concepts is how they connect. The master resolution equation (with its N, α, and k terms) is how we affect, change, and improve our separations by making adjustments to our method parameters. The graphical resolution equation is how we (and our software) measure the outcome of those changes directly from the chromatogram.
Understanding these principles empowers you to move beyond trial-and-error and adopt a more systematic and efficient approach to chromatographic method development. For a more detailed walkthrough of these concepts, including visual explanations and practical insights, be sure to check out the original video!
For more in-depth method development and troubleshooting training get an free Axion Lite membership.
