
Understanding Reference Wavelength in Chromatography
If the reference wavelength is activated, should the spectra range include the reference wavelength too? If not, what will happen?
I’m going to walk over to my laptop and open ChemStation to answer the question.
Software Overview: Agilent LC ChemStation
I’m running Agilent LC ChemStation. The official version of this is called B.04.03, and I believe it is still the most popular version out there. Even though it’s outdated officially—I think they stopped making this eight or ten years ago—but it’s still a favorite for many of us.
I have ChemStation loaded on the laptop, but it’s not connected to an LC, so you’ll notice that it thinks there’s a power failure. Sorry about that.
Method and Run Control Screen Overview
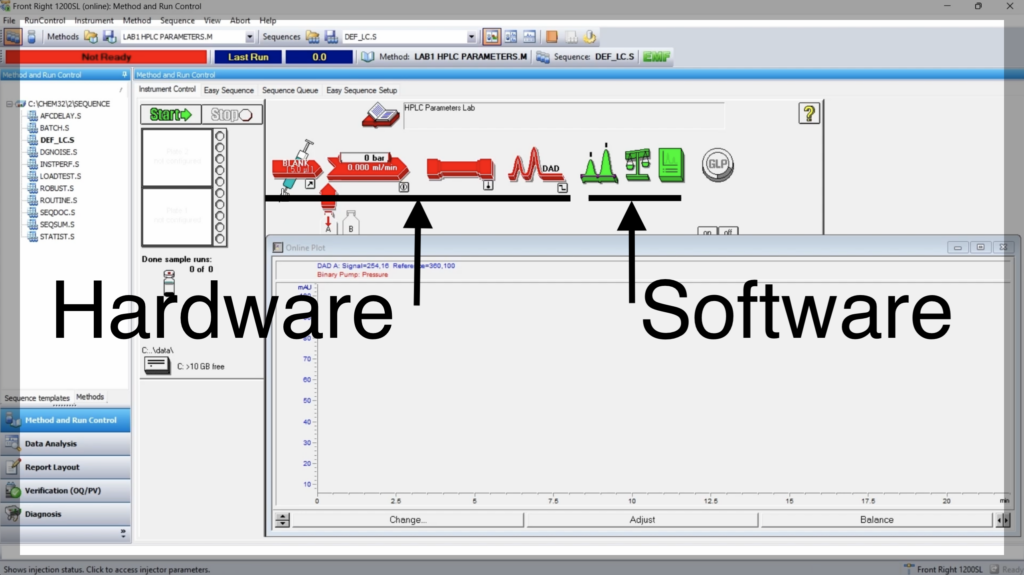
So, in this one, you can see the software.
This is the Method and Run Control screen, which includes the autosampler, pump, column, and detector.
This is where software integration, quantification, and report generation happen.
But this section here represents the hardware itself.
Reference Wavelength and Signal Processing
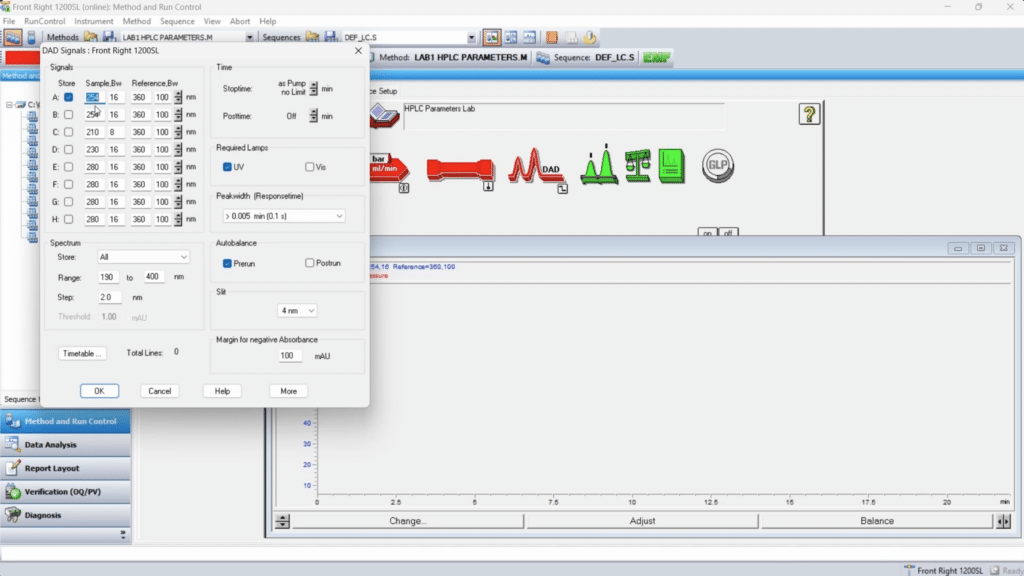
This question has to do with reference wavelength. If you go to the Diode Array settings, I’ll click on the Diode Array and look at the method information.
Let me simplify this for you. The top part of the screen, where it says Signals, refers to the wavelength we want to use for chromatography.
- In this case, the most popular wavelength is 254 nm, which works great for aromatic compounds.
- The bandwidth is the plus or minus nanometers. Instead of just looking at 254 nm, we use 254 ± 8 nm to improve sensitivity and the signal-to-noise ratio.
Why Do We Use a Reference Wavelength?
Believe it or not, your Diode Array Detector (DAD) is subtracting whatever is in the reference area from the sample signal.
- Every 80 times per second, it takes a data point from the signal and subtracts it from the reference signal.
- Example: If the reference is set to 360 nm ± 50 nm (a 100 nm bandwidth), it averages all the values in that range and subtracts it from the sample signal at 254 nm.
- This helps remove noise, including lamp noise and refractive index noise.
How to Handle Negative Peaks
If you ever get a negative peak with a Diode Array Detector, it’s usually because something absorbs light in the reference range (e.g., a colored compound like green, red, or purple).
Solution:
- Simply turn off the reference wavelength in settings.
- Once turned off, you will never get a negative peak again.
Do You Need to Include the Reference Wavelength in the Spectra?
The short answer is: No.
Key Takeaways:
- You don’t have to include the reference wavelength in the spectra.
- By default, ChemStation does not collect spectra unless you manually enable it.
- Chromatogram signals (used for integration & quantification) are separate from spectral data collection.
- Storing all spectral data is recommended because file sizes are small (1-2 MB per file).
Peak Purity Analysis
What Is Peak Purity?
Peak Purity measures whether a peak consists of a single compound or if multiple compounds are eluting together.
- It does this by analyzing UV spectra across a peak to see if they remain consistent.
- The method uses a similarity curve to compare spectral overlays.
How to Check Peak Purity in ChemStation
The “Poor Man’s Peak Purity Tool”
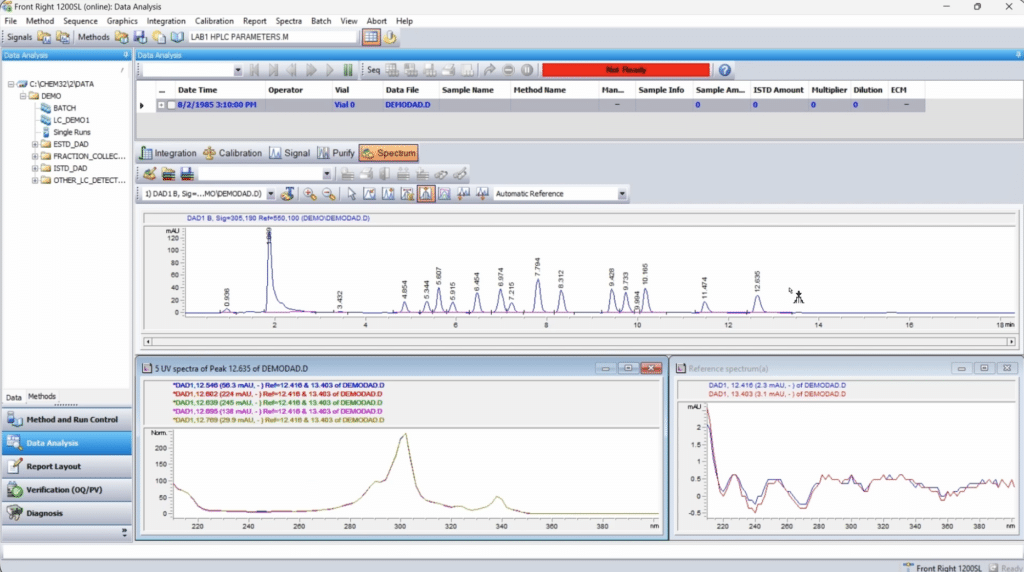
- Click on a peak, and the software extracts five spectra across it.
- It overlays them—if they all align perfectly, the peak is pure.
- If there are noticeable differences, the peak is impure (possibly two coeluting compounds).
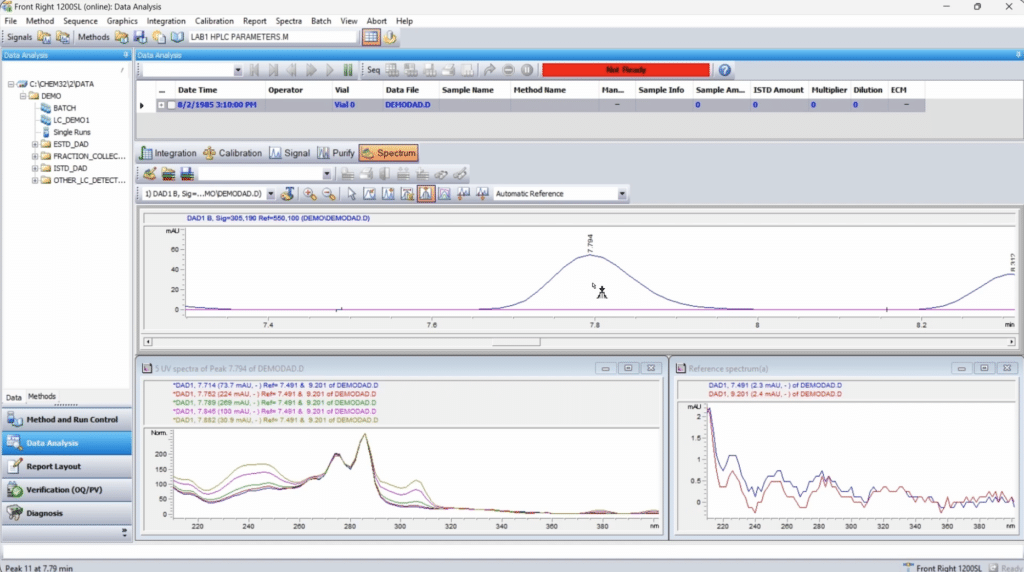
Example:
- A perfectly symmetrical peak may still be impure if its spectral overlays don’t match.
- One specific peak in the Demo_DAAD dataset looks symmetrical but is actually two overlapping peaks.
Pure Peak
Impure Peak
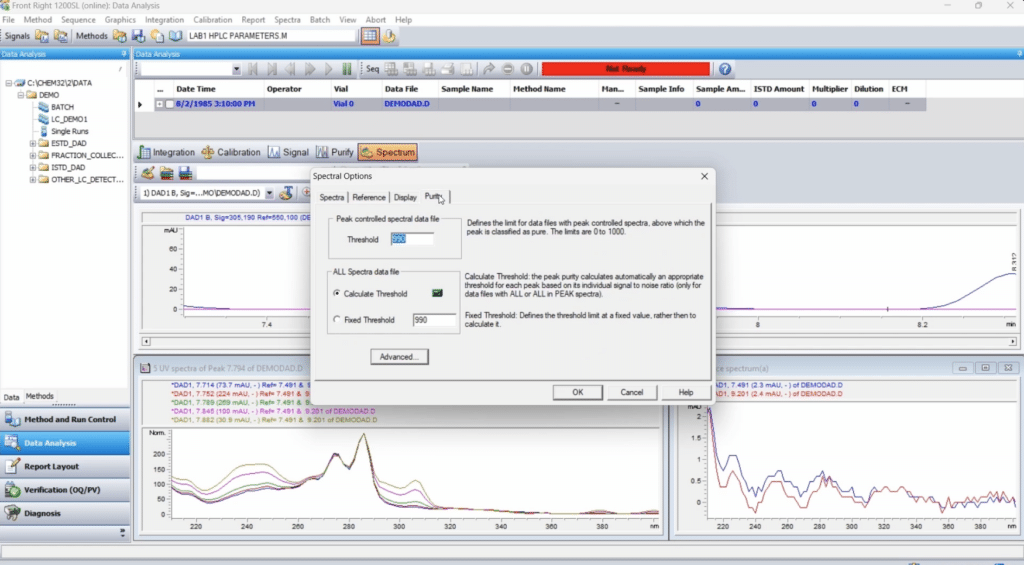
How to Set Peak Purity Thresholds
In ChemStation, navigate to: Spectral Options > Purity
You have two options:
- Calculated Threshold (default):
- The system measures noise in the first 10 seconds of the chromatogram.
- It uses a statistical calculation based on standard deviation.
- Downside: Results may change daily due to minor variations in conditions.
- Fixed Threshold (Recommended for Consistency):
- This setting ensures consistent purity analysis across different runs.
- It helps detect coeluting peaks more reliably.
Final Thoughts
- The reference wavelength does not need to be included in spectral data.
- Turning off the reference wavelength prevents negative peaks.
- Peak purity analysis is essential for detecting coelution.
- Use fixed thresholds for consistent peak purity assessment.
Next Steps: Send Us Your Questions!
I’ll be fixing instruments and doing more videos, so send in your suggestions and questions! We’d love to hear from you. 🚀
